|
The
Diamond Brick Road
Updated
September 29, 2003
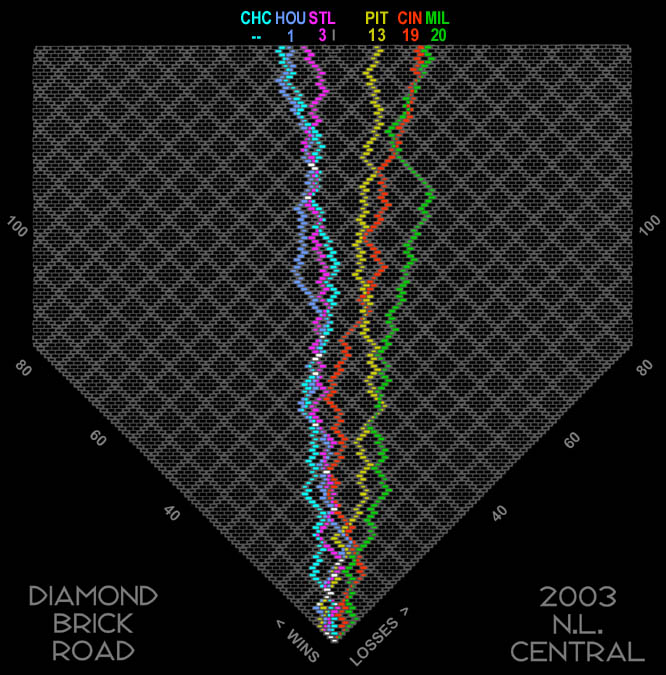
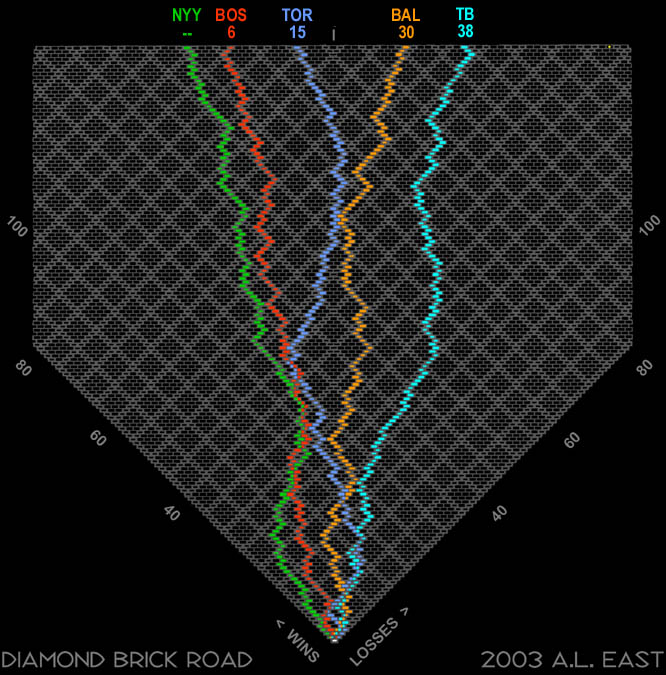
The
above diagrams chart the progress of two divisions of major league
baseball for the 2003 season.
I
invented the Diamond Brick Road in the late 1980s, but this is the
first time I've displayed it on the Internet. How does the
diagram work? Let's zoom in.
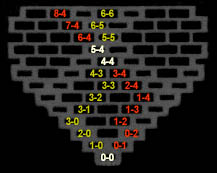
Here's
a closeup of the brick road for a short 12-game
"season." Every team starts the season at the bottom brick.

With
each game, a team moves in one of two directions: 
For
a win, the team moves one brick "northwest," towards third
base. For a loss, the team moves one brick "northeast," towards
first base.
|
For
example, the Yellows start with an 0-0 record. They win three
straight to go to 3-0, then lose the next three to fall to 3-3.
Then they alternate wins and losses to finish the 12-game season with
a record of 6-6.
Notice
that every brick that corresponds to a .500 record (such as 3-3 or
6-6) lies directly above 0-0. This .500 "flagpole
line" points straight toward center field. |
 |
|
- |
|
|
The
Scarlets also start from 0-0, of course. Since both teams own
the 0-0 brick, we color it white. The Scarlets have a losing
record for a while and fall to 1-4, but then they reel off seven
straight wins. During this winning streak, the line of red
bricks heads straight for left field. The Scarlets finish their
12 games at 8-4, two games better than the Yellows' 6-6. |
 |
We
can look at all this using another pair of orthogonal axes: 
"Games
played" are measured vertically. Both the 8-4 and 6-6
bricks, representing 12 games played, are 12 levels above the 0-0 brick.
"Games
back" are measured horizontally. The 6-6 brick is two
full bricks to the right of the 8-4. If the Yellows had
finished 6-5, they would have been 1½ bricks (or games)
behind the 8-4 Scarlets.
|
And
we can even use a third set of axes: radial coordinates.
The
vector from the origin (0-0) to a team's last brick (8-4) forms an
angle (60°) with the first-base line that is proportional to the
team's winning percentage. |
 |
|
Angle |
0º |
30º |
45º |
60º |
90º |
|
Winning
Pct. |
.000 |
.333 |
.500 |
.667 |
1.000 |
The
math is fun for me. What's fun for all us of is watching the
colored lines snake their way up the brick road, through hot streaks
and cold streaks, crossing and recrossing each other, as the teams
climb toward the finish line represented by the 162nd level of bricks.
(Charting
the Pirates year by year: 2011
2012 2013
2019
2020
2021. Charting the historic
streaks of the Dodgers and the Indians: 2017.
For a hockey version of this chart, click here.)
|